Study Guide: Math Term III
1. Rates, ratios and proportions
2. Student should be able to use a Cartesian plane
3. Write word problems using ratios
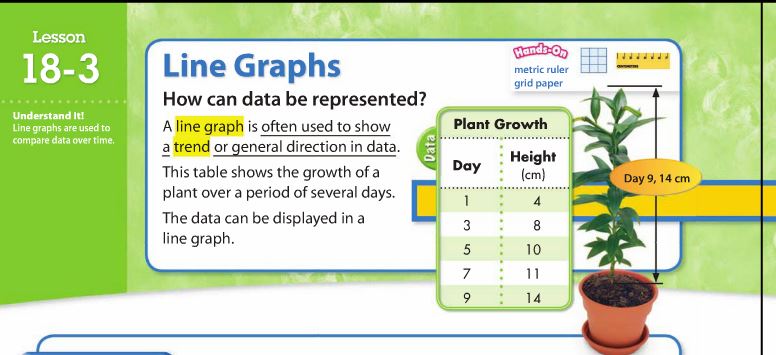
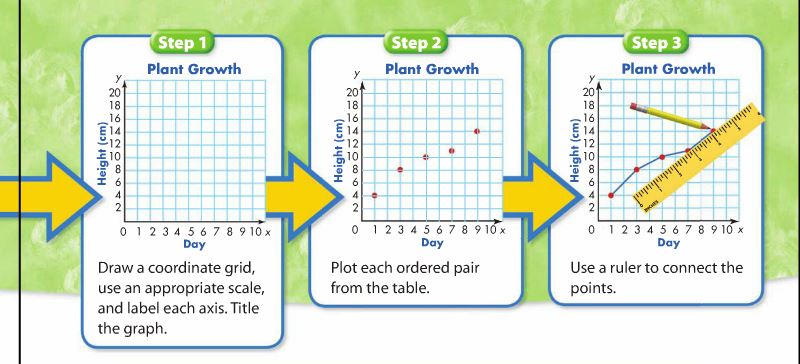
4. Writing ratios in different ways: word problems, numerical, charts and line graphs
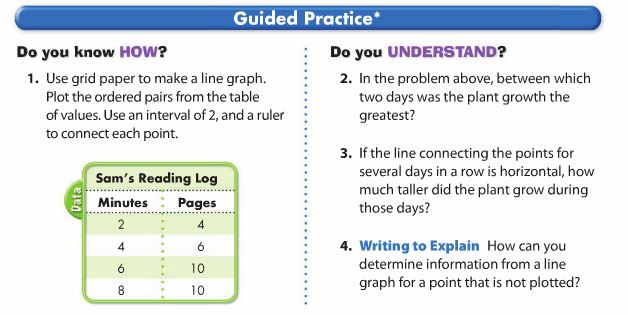
5. Student should be able to do and read bar graphs, pie charts and line graphs
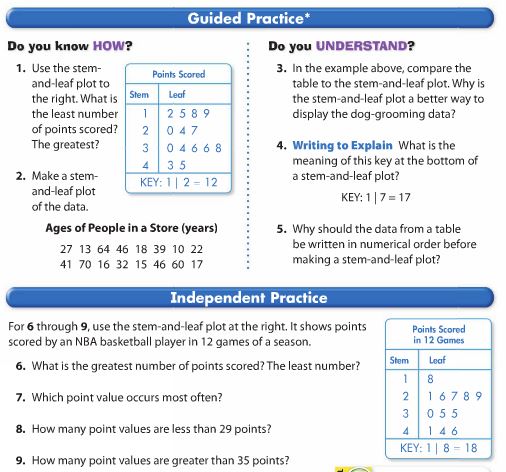
6. Statistical information: stem and leaf plots
7. Cross-product method
At Home Practice
ACTIVITY ONE: Review RATIOS
HOMEWORK # 1
Envision Workbook: page 112 #1- #7
Activity TWO: Review RATES
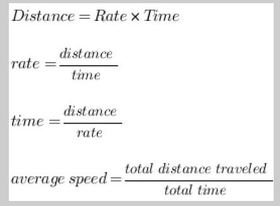
Use the information in your notebook or the chart to the left to calculate the following problems.
Show your work.
1. Mike roller skates 73.3 miles in 4 hours and 53 minutes. What is his average speed in miles per hour?
2. Nancy drives her car with a constant speed of 61 km/h. How far can she travel in 4 hours 32 minutes?
3. Cindy rides her bike for 1 hour and 13 minutes with a constant speed of 9 mph and then for another 2 hours and 38 minutes with a constant speed of 6 mph. What distance did she travel?
4. An airplane flies with a constant speed of 780 miles per hour. How far can it travel in 165 minutes?
Activity THREE: Review Proportions
- Username and Password on Campestre's webpage under Estudiantes
- Search for PROPORTIONS
Use the information in your notebook to calculate the following problems.
1. It takes about 20 minutes to grade a student’s paper. How long, in hours, does it take to grade papers for a class of 25 people?
2. The ratio of men to women at a class is 6 to 5. How many women students are there if there are 3600 men?
3. A company’s quality control department found and average of 5 defective models for every 1000 models that were checked. If the company produced 60,000 models in a year, how many of them would be expected to be defective?
4. In the year 2000, there were 8.7 deaths per 1000 residents in the United States. If there were 281,421,906 residents in the U.S. during 2000, how many people died that year?
Activity FOUR: Ratio, Proportions, and Rates Review
WEEK 3 In-Class Activities
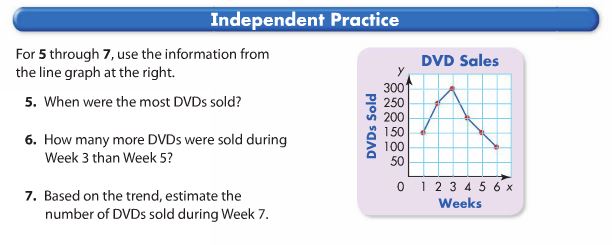
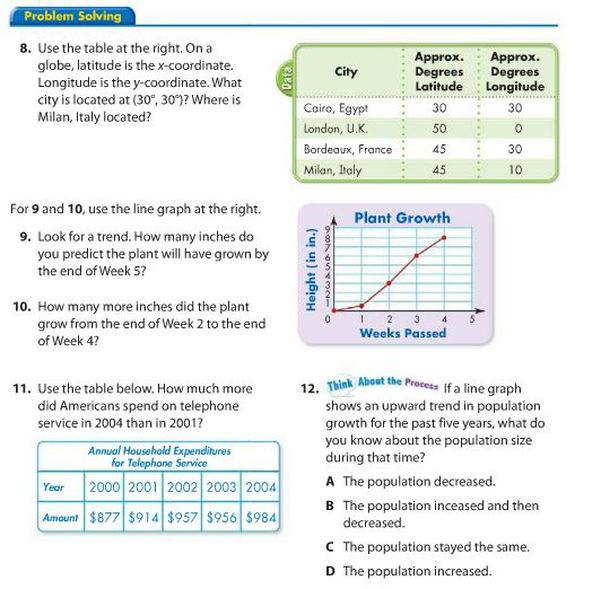
- In your math notebook, take notes of the next two images. (images from Envision Math Pearson SuccessNet)
- Answer the following questions in your notebook.
Week 4 In-Class Activity
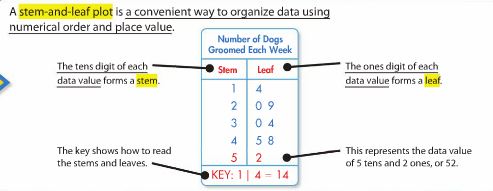
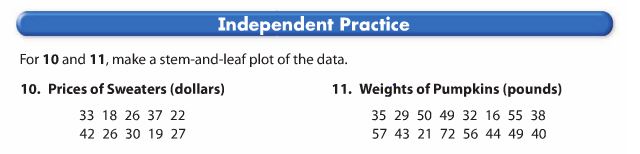
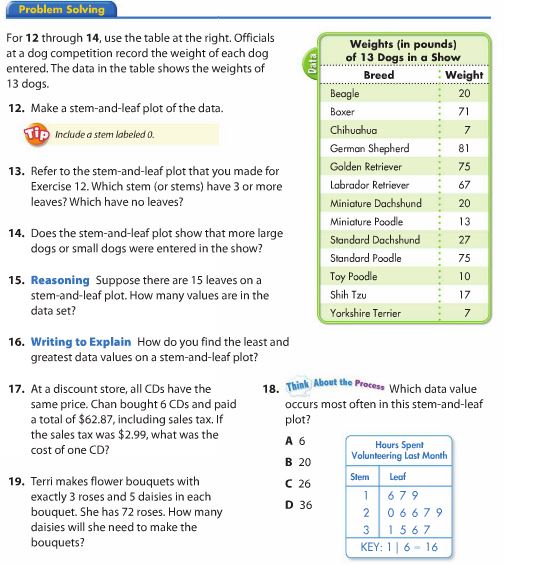
- Take notes in your notebook from the image below. Title: STEM-AND-LEAF PLOTS: Organize data
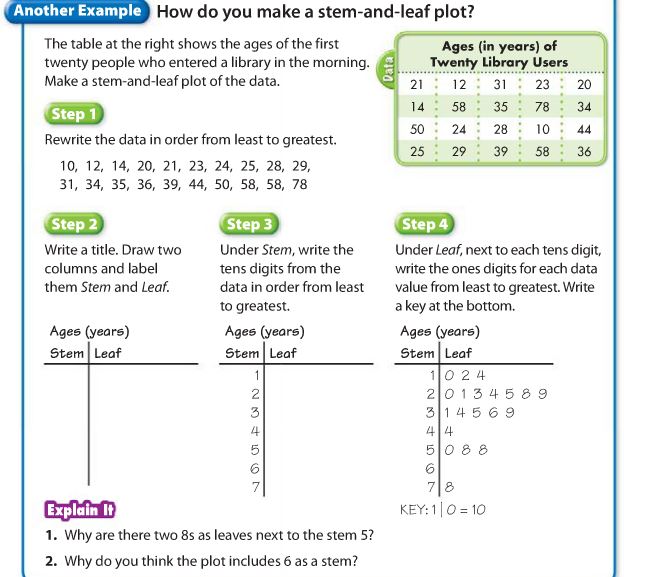
- Answer questions #1, #2 above. Check with your teacher before you continue.
- After you check with the teacher, do the next problems in your notebook Show your work. Use the example below to answer #3.
Make a table.
Write the ratios or proportions.
Write a problem.
| week_4_graph_2.docx |
| week_4_graph_1.docx |
Week 5 In-Class Activity
A) Take notes. Write a summary of the video.
B) Do the activities with the RULER only. Check your answers.
C) Answer this question in your notebook: What did you learn from the activities above?
D) Do the following problems in your notebook. Show your work.
Copy the problem. Correct your answers in a different color.
E) Show your work in your notebook. Show the proportion and how you solved.
Check your answers in different color.
Week 8- End of Term Project Instructions
4th Grade Mathematics Term Project: Graphing
For your term project, you are required to collect data and create multiple graphs that you will post on your webpage under Math Term III. The data you collect will be based on a topic of your choice (topic must be approved by teacher). You will be responsible for collecting the data and recording it from multiple sources suggested on the timeline below. Once you have collected all your data you will create a rough draft on graph paper of the 3 different types of graphs we have been learning about. Follow the timeline below to ensure you stay on track!
Week 1 (May 11-15): This week you will use to brainstorm your topic/question. You must pick a topic that will allow you to create (at least) 10 categories. You will be given a brainstorming sheet, please keep it in your notebook attached to this sheet. You must check with your teacher that your topic is appropriate to use.
Week 2 (May 18-22): This week you will collect your data. Keep your information in and organized chart, attached to this sheet. Every time you collect more information add it to your data sheet. You may use multiple sources to find information. (I.e. asking peers, family members, friends, the Internet, magazines…). You will have class time to do some research.
Week 3 (May 25-29): This week you will organize the data you have collected into a frequency table or tally chart. Display the data clearly to ensure it will match with the graphs you will create. You will create your table on paper, and attach it to this sheet. You will also make a rough draft all the graphs you will be making online.
Week 4 (June 2-5): This week you will be creating your online graphs and online table. First, go to Word and create a table to display your data. (Click inset table, and choose the number of rows you need. You should have TWO columns; the categories and their value. Save your table and upload it to your webpage.
Second, create the graphs. To create use this website: (The link will be on the fourth grade weebly page) http://nces.ed.gov/nceskids/graphing/classic/
You must save the table with your data, as well as each graph you make. (To save, right click the image. Once saved, upload each graph to your webpage.
After you have saved and uploaded everything, your teacher will see the work you have done in Weeks 1-3. You should have this sheet, your brainstorm, you data collection, your handwritten table and graphs.
Should you need help, there will be an example on the gc fourth grade weebly page.
WEEK 9
Watch the video.
Take notes. (in your own words)
Then, follow the teacher's instructions.
Take notes. (in your own words)
Then, follow the teacher's instructions.
Week 11
| week_11_math_mc1_mc2.docx |
